Which Agreement Measurement Method Should I Use?
A simple guide to use specific method in a project
When assessing whether two observers, instruments, or methods produce similar results, choosing the right statistical measure of agreement is crucial. This guide will help you navigate the options and select the most appropriate method for your data.
What is Agreement?
Agreement (also called concordance or reproducibility) refers to the degree of concordance between two or more sets of measurements made on the same subjects. This is fundamentally different from correlation:
| Aspect | Agreement | Correlation |
|---|---|---|
| Purpose | Same measurements? | Related measurements? |
| Focus | Same variable | Different variables |
| Key insight | High correlation could poor agreement | Agree, must be correlated |
⚠️ Common Pitfall: High correlation does not imply good agreement! Two methods can show r = 0.98 correlation while still having clinically unacceptable differences.
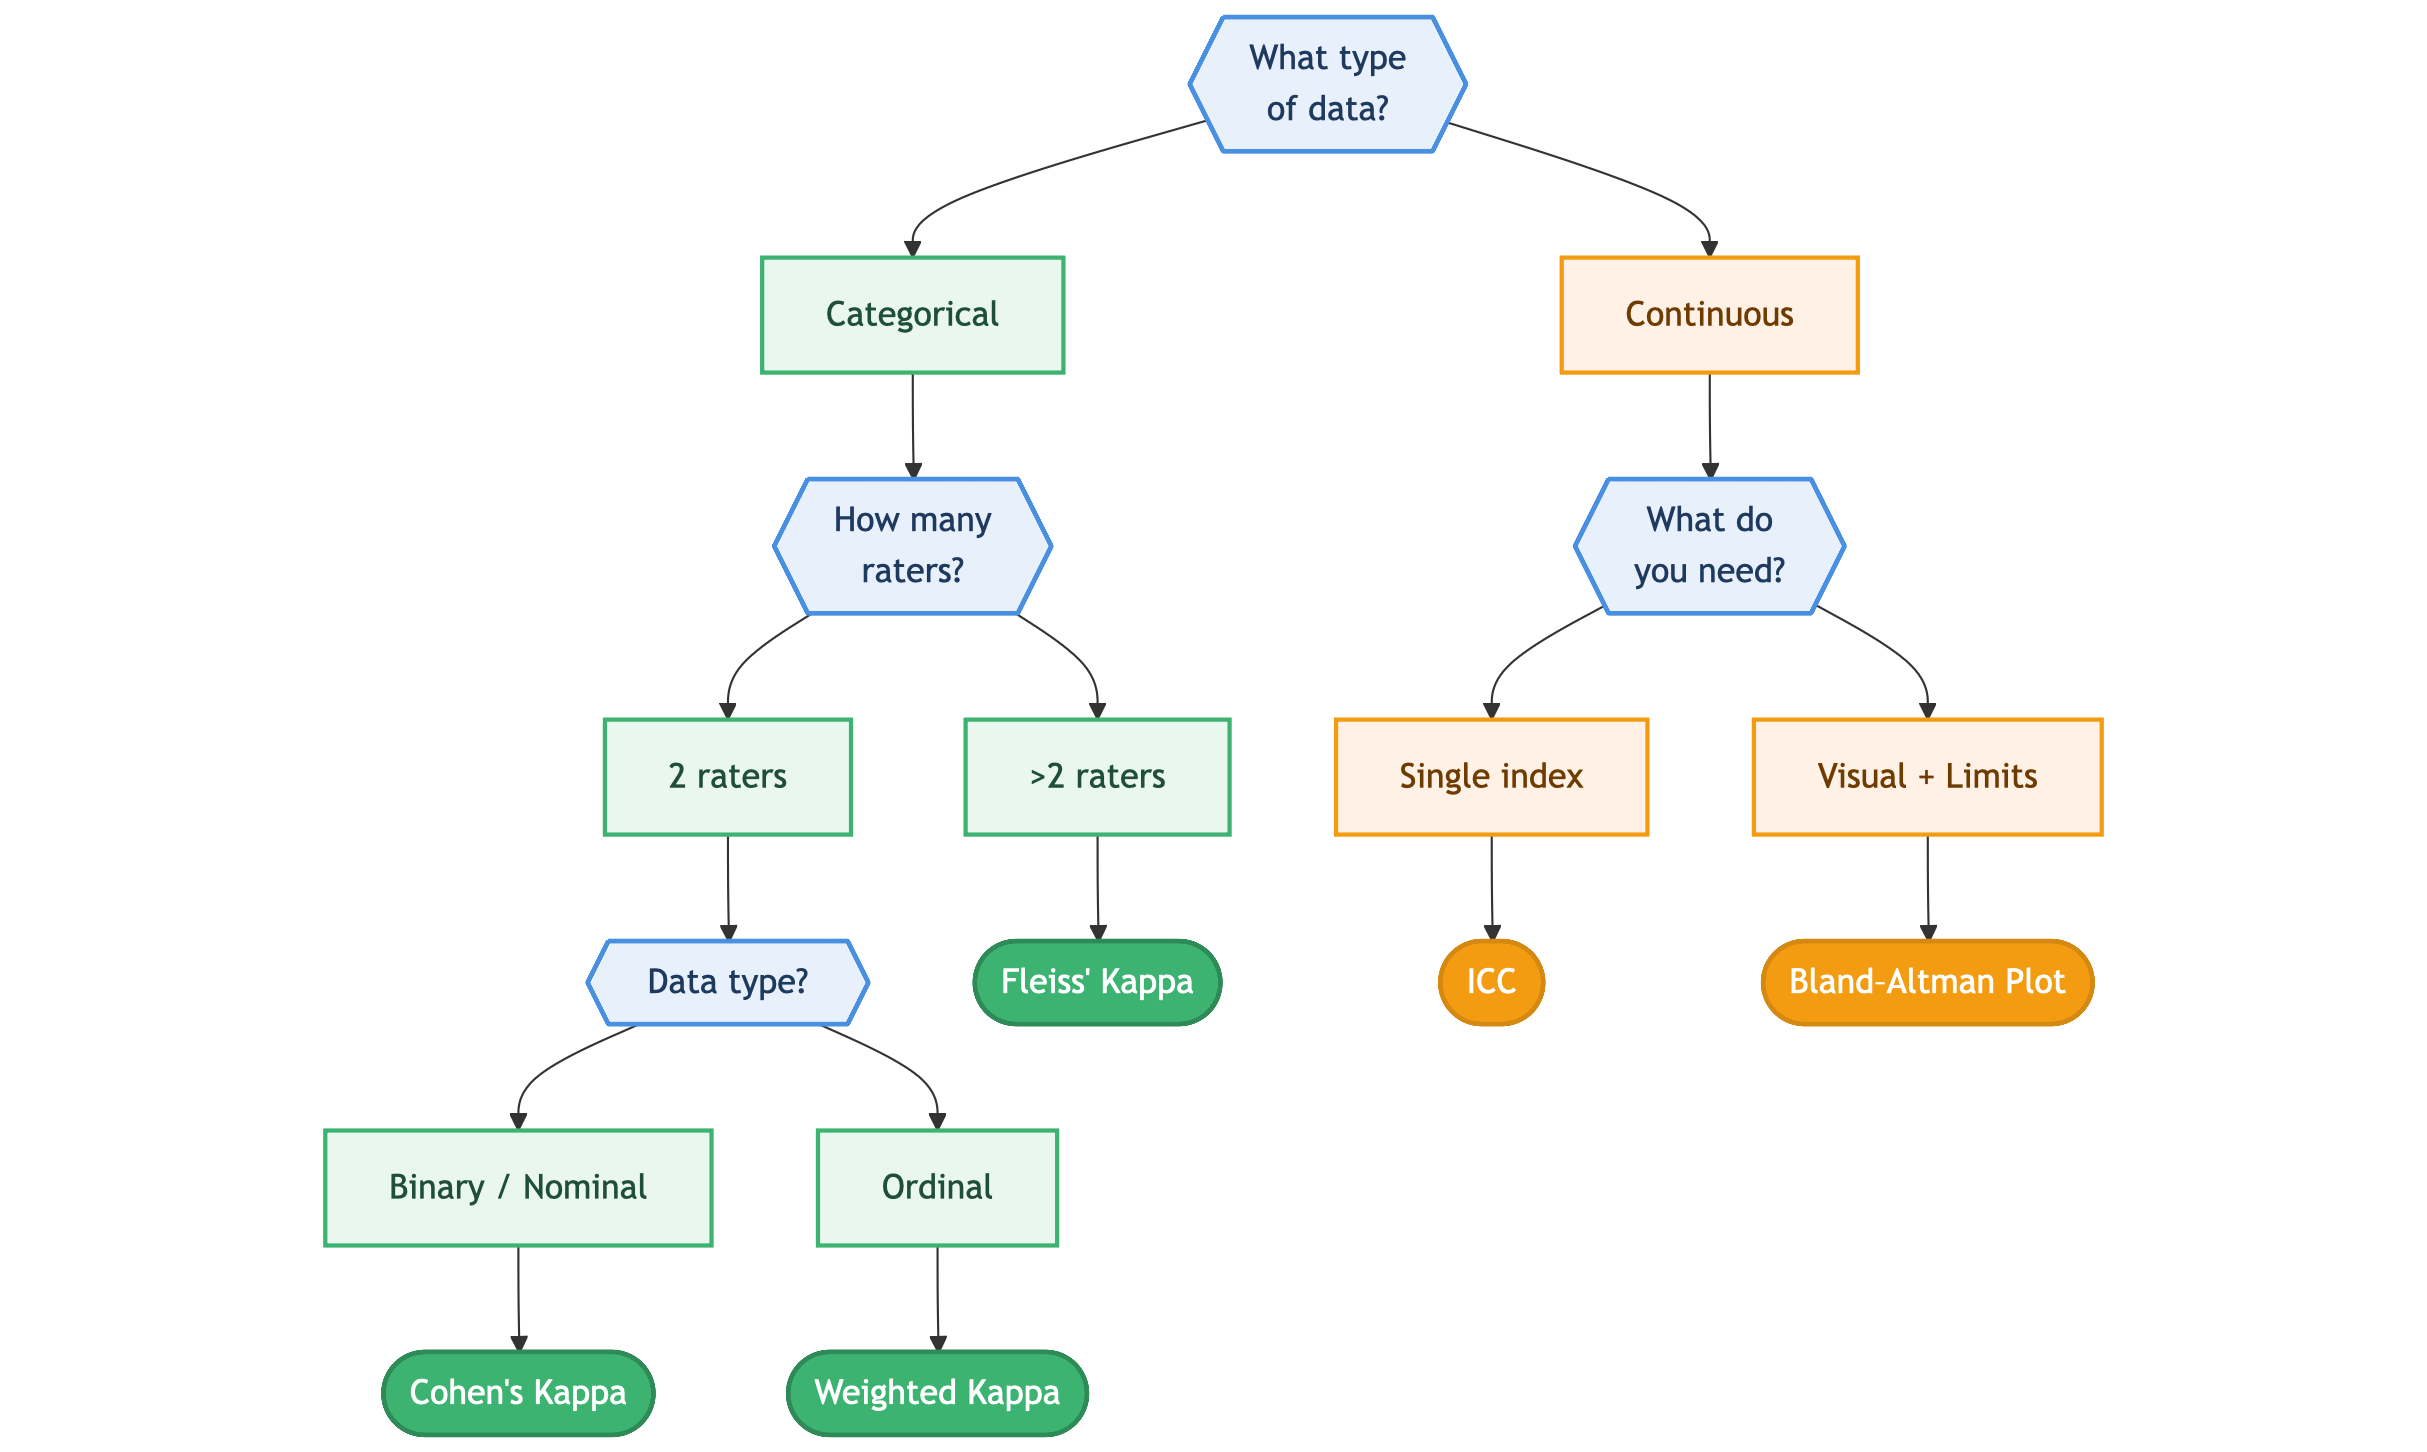
Decision Flowchart: Which Method Should I Use?
Methods for Categorical Data
Cohen’s Kappa (κ)
When to use: Two raters assessing binary or nominal categorical outcomes.
Cohen’s kappa accounts for agreement occurring by chance:
\[\kappa = \frac{P_o - P_e}{1 - P_e}\]Where:
- Po = Observed agreement
- Pe = Expected agreement by chance
Interpretation Guide
| Kappa Value | Interpretation |
|---|---|
| < 0 | Less than chance agreement |
| 0.01 – 0.20 | Slight agreement |
| 0.21 – 0.40 | Fair agreement |
| 0.41 – 0.60 | Moderate agreement |
| 0.61 – 0.80 | Substantial agreement |
| 0.81 – 0.99 | Near-perfect agreement |
| 1.00 | Perfect agreement |
Alternative interpretation: κ < 0.60 indicates a significant level of disagreement.
Limitations
- Does not account for magnitude of differences (unsuitable for ordinal data)
- Cannot be used with more than two raters
- Does not differentiate between agreement for positive vs. negative findings
Weighted Kappa
When to use: Two raters assessing ordinal categorical outcomes where magnitude of disagreement matters.
Example: Microbiologists rating bacterial growth as none, occasional, moderate, or confluent. A discrepancy between “occasional” and “moderate” is less severe than between “none” and “confluent.”
Weighted kappa assigns weights to disagreements:
- Linear weighting: Equal penalty per category difference
- Quadratic weighting: Larger penalty for bigger differences
Fleiss’ Kappa
When to use: More than two raters assessing binary or ordinal categorical data.
This extends Cohen’s kappa to handle multiple observers rating the same subjects.
Methods for Continuous Data
Intraclass Correlation Coefficient (ICC)
When to use: You need a single summary measure of agreement between continuous measurements.
ICC estimates overall concordance by examining between-pair variance as a proportion of total variance.
| ICC Value | Interpretation |
|---|---|
| < 0.50 | Poor |
| 0.50 – 0.75 | Moderate |
| 0.75 – 0.90 | Good |
| > 0.90 | Excellent |
Note: There are multiple forms of ICC depending on your study design (single vs. average measures, consistency vs. absolute agreement).
Bland-Altman Plots
When to use: You want to visualize agreement and determine limits of agreement between two measurement methods.
How it works
- Plot the difference between two measurements (Y-axis) against their average (X-axis)
- Calculate the mean difference (bias)
- Calculate 95% limits of agreement:
What it tells you
- Bias: Systematic difference between methods (mean line)
- Precision: How scattered the differences are (SD)
- Limits of Agreement: Range within which 95% of differences fall
⚠️ Important: There is no universal criterion for “acceptable” limits. This is a clinical decision based on the variable being measured.
Common Mistakes to Avoid
❌ Using Correlation Instead of Agreement
Even with r = 0.98, two methods may not be interchangeable. Correlation shows relationship; agreement shows concordance.
❌ Using Paired Tests (McNemar’s, Paired t-test)
- McNemar’s test: Compares overall proportions, not individual agreement
- Paired t-test: Compares mean differences; can be non-significant even when individual differences are large
❌ Using Simple Percent Agreement
Percent agreement ignores chance agreement. Two raters guessing randomly would still show ~50% agreement for binary outcomes.
Quick Reference Summary
| Data Type | Raters | Recommended Method |
|---|---|---|
| Binary/Nominal | 2 | Cohen’s Kappa |
| Ordinal | 2 | Weighted Kappa |
| Any Categorical | >2 | Fleiss’ Kappa |
| Continuous | 2+ | ICC (single index) |
| Continuous | 2 | Bland-Altman (visual + limits) |
References
- Ranganathan P, Pramesh CS, Aggarwal R. Common pitfalls in statistical analysis: Measures of agreement. Perspect Clin Res. 2017;8(4):187-191.